
We hide nothing.
Our finances are public. Our overhead is 3%. Check our work.
Butterfly Collaborative US believes that financial transparency isn't optional — it's the foundation of donor trust.
We publish our 990s, maintain clean books, and work with a nonprofit accounting specialist to ensure our reporting meets the highest standards.
We're currently working toward a Charity Navigator five-star rating, which requires public access to our tax returns. You can find them below.
Document links:
[Form 990 — 2021] [PDF link — Minita to provide]
[Annual Impact Summary — 2024] [When available]
Financial snapshot (visual — screenshot or infographic):
Total revenue: [TBD]
Program expenses: [97%]
Operating overhead: [3%]
Feeding center operations: [$60,000/year for 30,000 children]
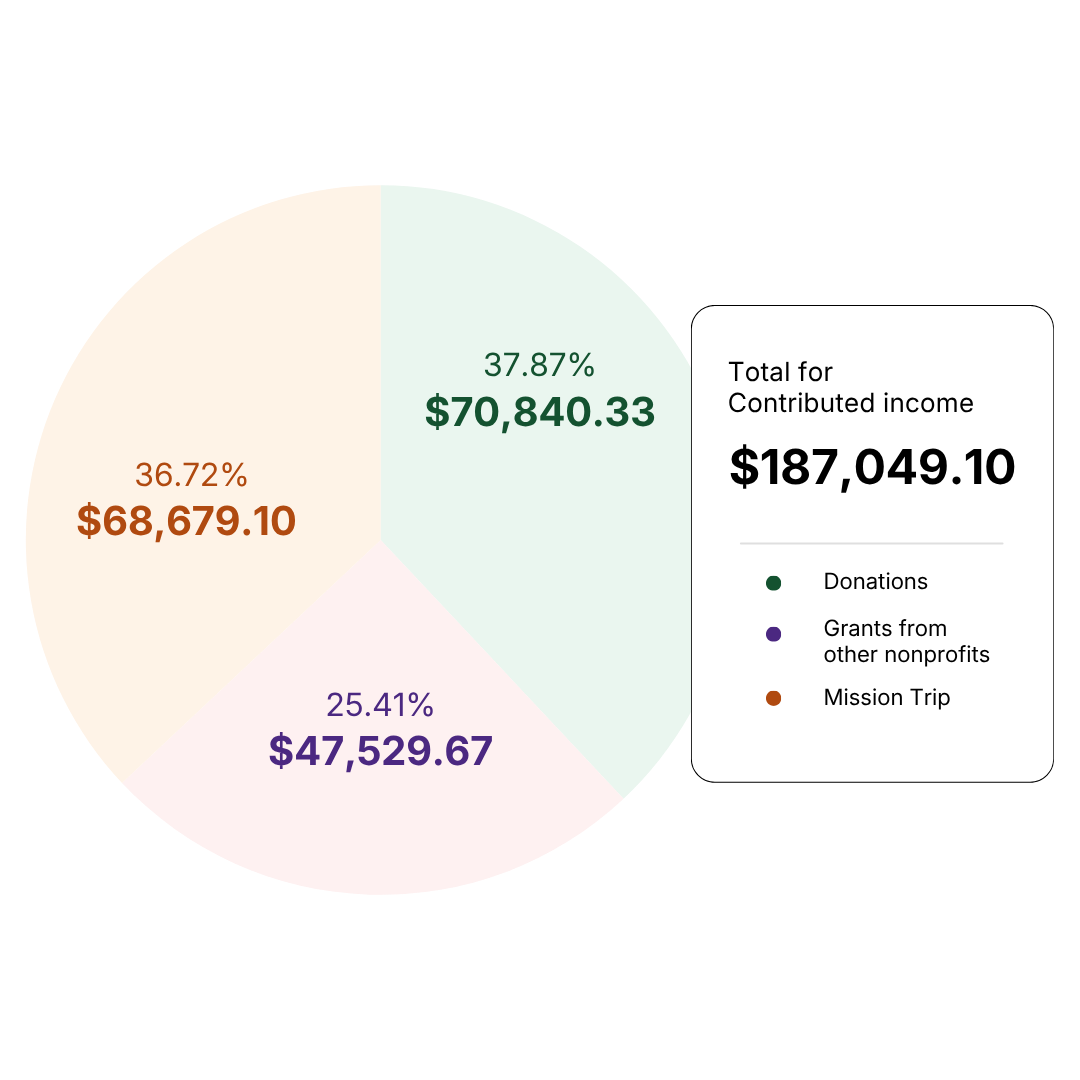
Contributed income
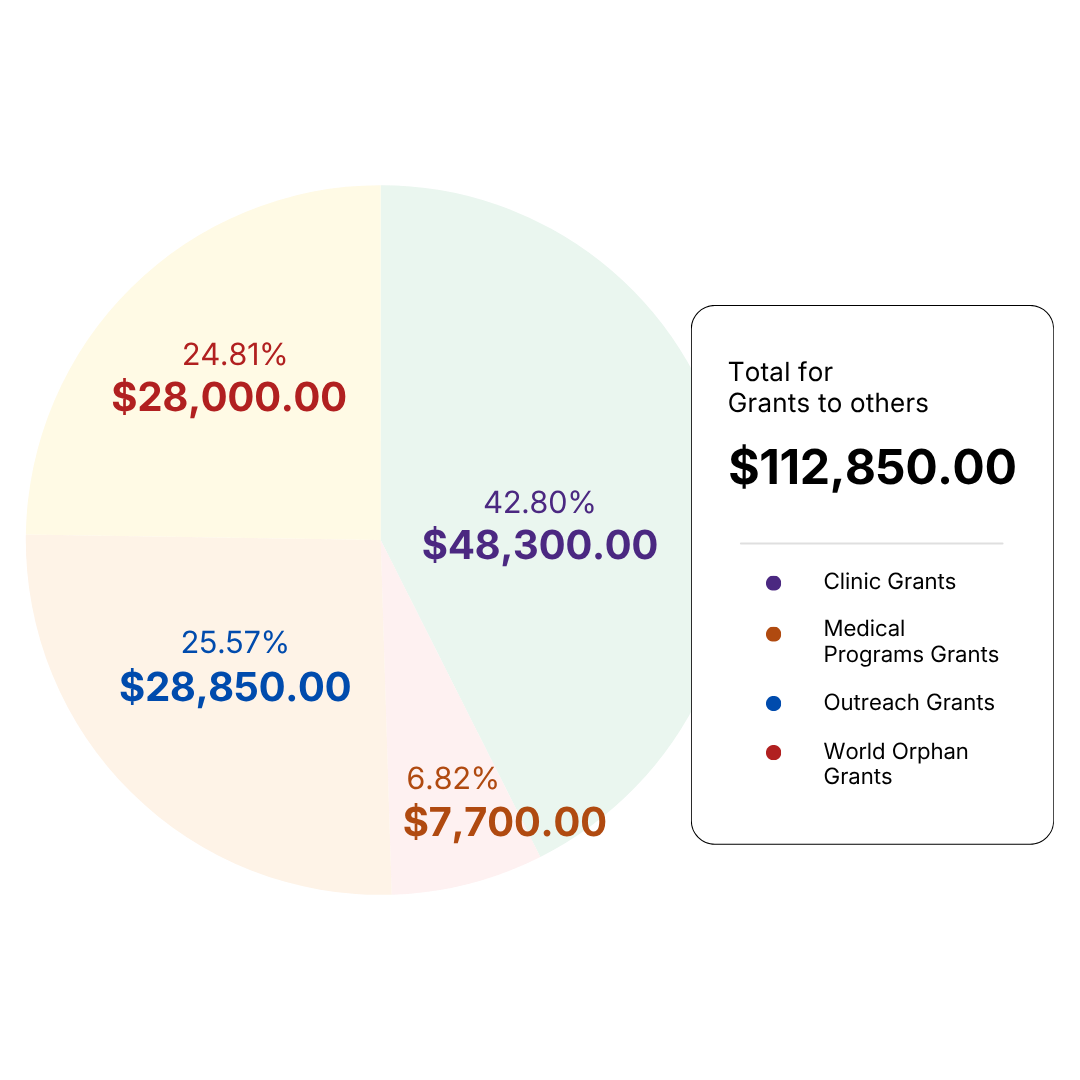
Total for Grants to others
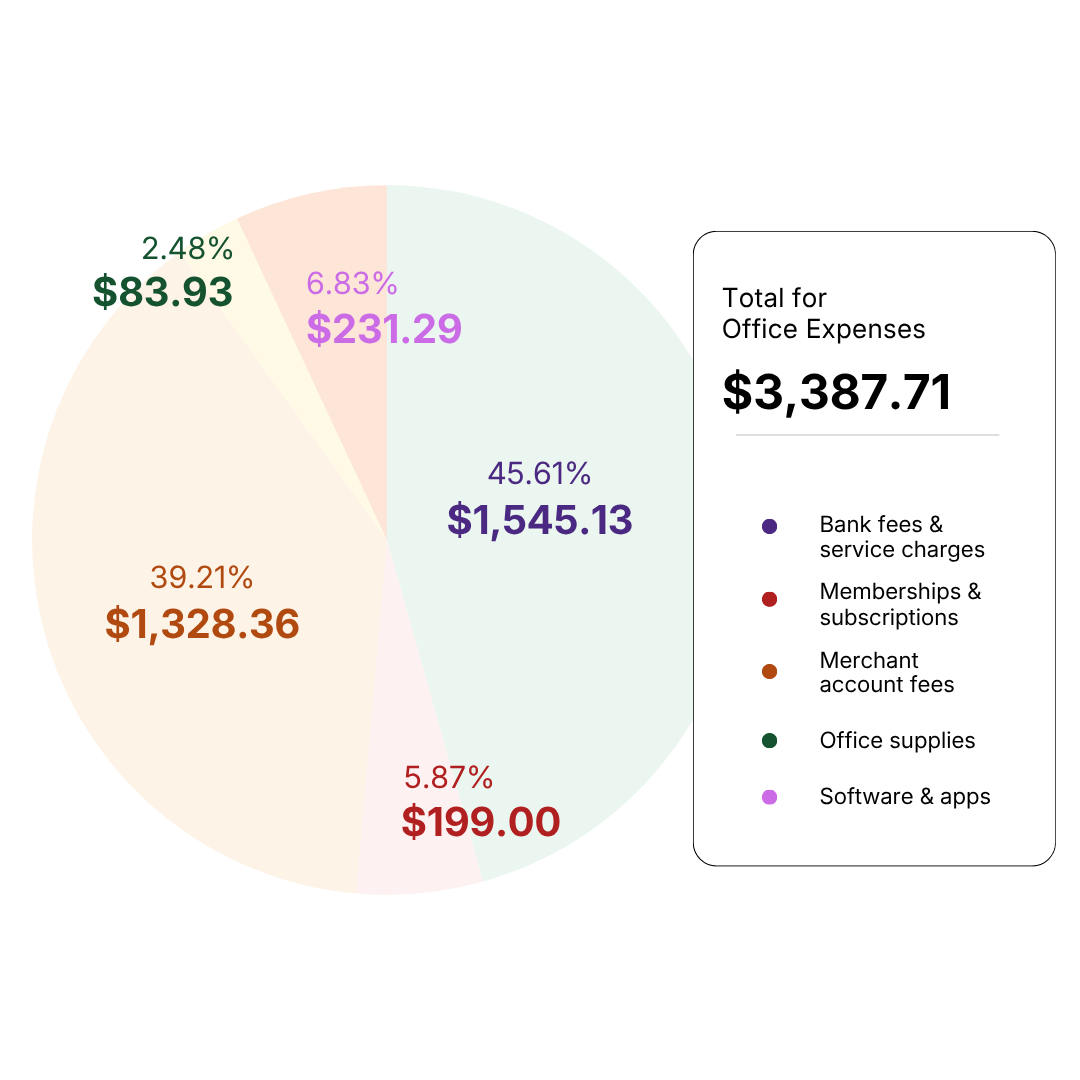
Total for Office expenses
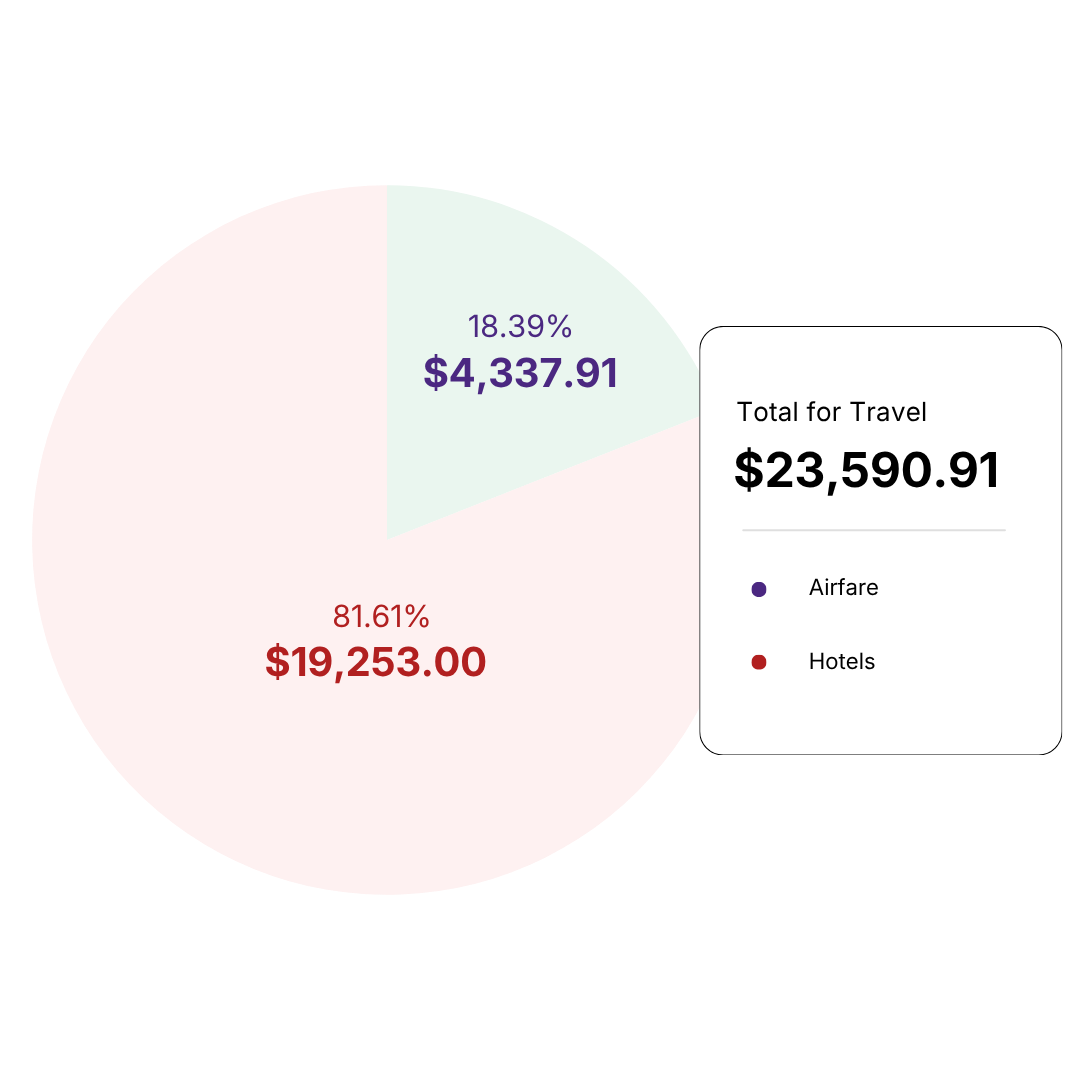
Total for Travel
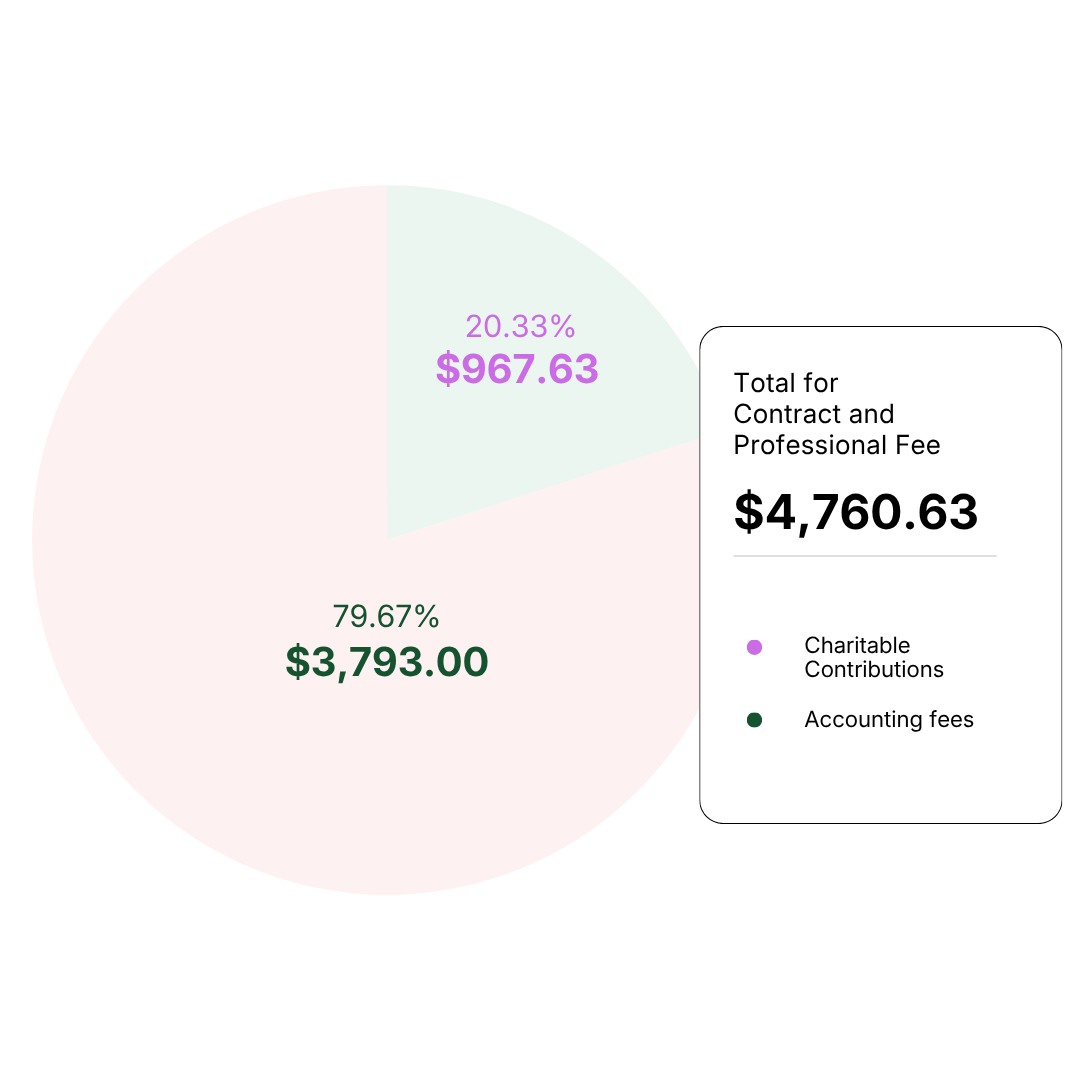
Total for Contract & professional fees
Additional expenses report
-
$ 10.00
-
$ 678.00
-
$ 1.06
-
$ 34,493.12
-
$58,084.03
-
$179,771.43
-
$7,277.67
-
$7,277.67